
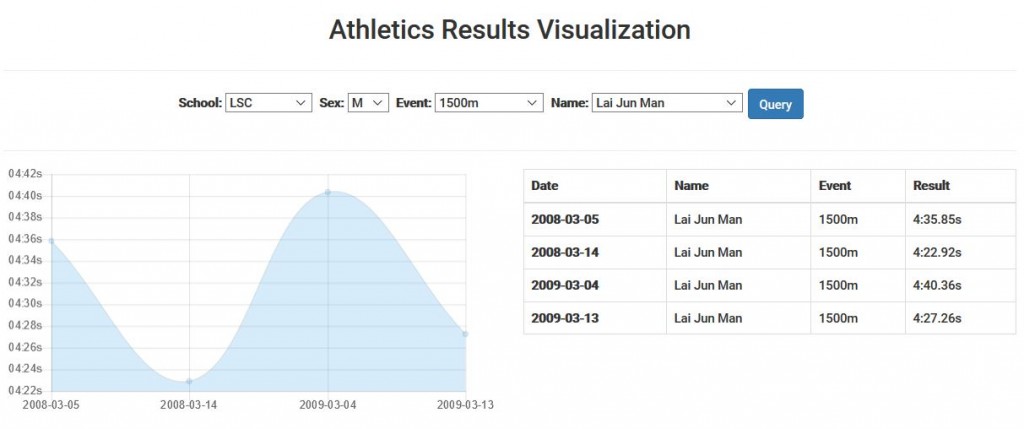
Visualizing athletics results data in graphs and tables
Motivation
As an athlete when I was younger, I had taken part in various competition, yet the most important one was always the one in Wan Chai Sports Ground for the HKSSF Division One Athletics Competition. After seeing some live and thrilling action going on this year, I found it so difficult to look up an athletes performance over the years. The data is still in this old text format in PDF files. It just makes it very difficult so how an athlete has performed over the past asd years.
Work
This project involved practicing techniques from Java Script, Python, organizing database files and regular expression. It was a nice fun to work across multiple languages and get it everything set up and work accordingly. Here are a list of the difficulties I encountered and what I did with them.
- Chart.js does not support time duration data on the y-axis
- I had to write my own callback function for handling this case.
- Unclean data
- Tried as many regular expression replacements as possible.
- Still, some manual replacement was required.
- AJAX drop down buttons
- Originally, I wanted to support some complex relationship between the AJAX drop down buttons.
- It ended up too convoluted and the final solution was a decision tree from left to right.
Rework from Django app to Vue JS Static Website
The first implementation was done in 2018 and the website was converted from a Django app to a static website built with Vue JS as part of the “Zero Server Cost” initiative.
One of the major difference is that all the data was stored in backend before and ajax queries was used to get back the display data. The new approach downloads the entire dataset, which is about ~3MB. The user interface is now much more responsive, however, this slows the initial load time.
Hope you will enjoy the convenience of using this web app as well! :)

Comments