
An exploration project of bus data from Data.Gov.HK and GTFS
Introduction
Recently, I found out that Google Map does not show the best route observation and therefore, I did some digging and wrote up this project page on some of findings and work. Indeed, the Hong Kong government has grouped all transport data into their own API or database files on Data.Gov.HK. This project was in separated into 2 parts mainly.
- Mapping of bus route data from the Data.Gov.HK to the Google Map’s GTFS format
- Plotting of interesting statistics from the bus data
Part 1 - Data Mapping
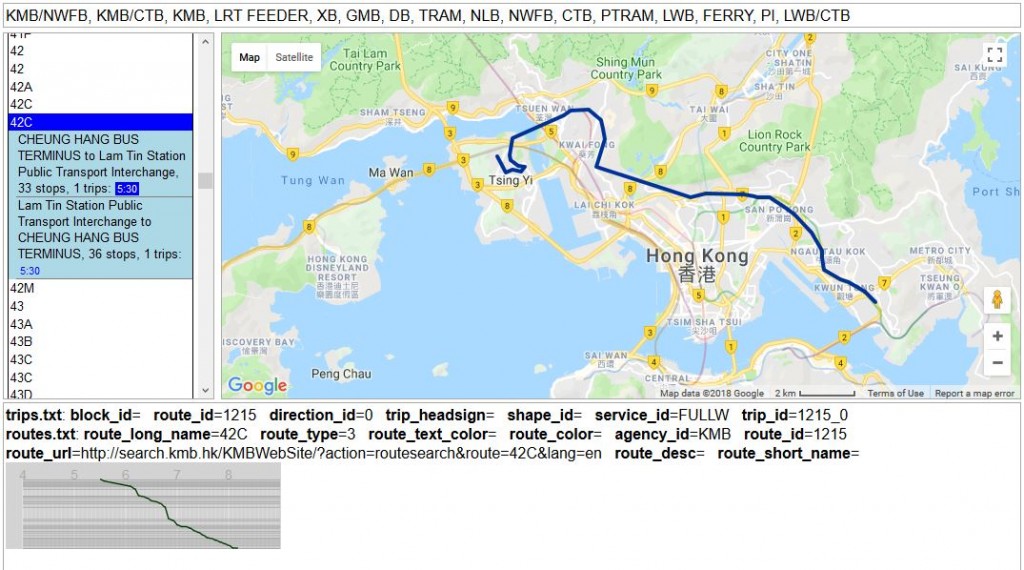
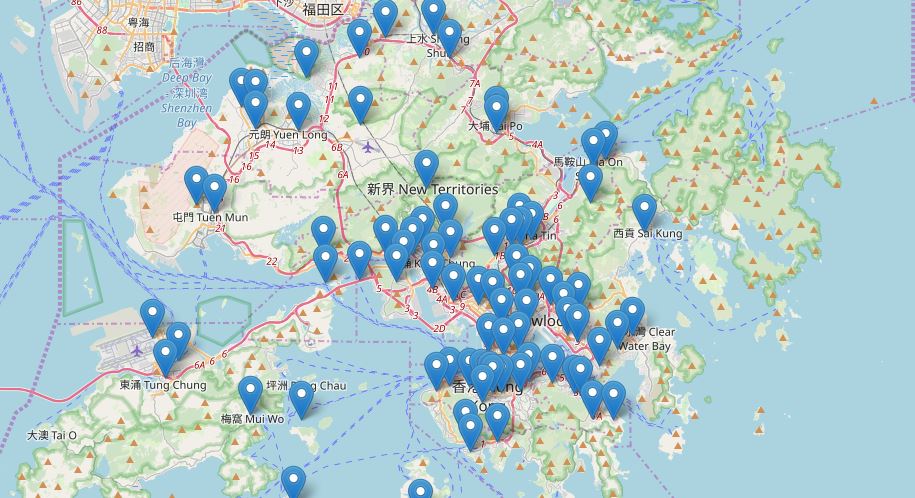
The bus data from from the Data.Gov.HK was mapped to the Google Map’s GTFS format.The script used can be found from the link. After mapping the data to a certain, the GTFS viewer can be used to view the results and a screenshot is shown below.
From the data conversion exercise, the following points were learnt.
- File format
- The file format used to store the data is *.mdb, which is a Microsoft Access database format. In order to access the data, using Windows is much easier. In fact, a much simpler csv file format may benefit users from different operating systems.
- Location Coordinates
- The data.gov.HK actually uses the HK80 coordinate system instead of the widely used WSG84 coordinate system.
- Lack of information from data.gov.HK
- Bus Schedule Information, which is required in stop_times.txt and frequencies.txt.
- Bus Transfer Price Discount
- For the GTFS side, I am not entirely sure whether the fare_rules.txt can represent the required logic.
- Bus Calendar Information
- This represents whether the bus will only be available for certain days of the year.
- Bus routes handled by 2 agencies
- In Hong Kong, there are some bus routes (e.g. 104) that are handled by 2 companies together. The only way to handle this in GTFS is to have a new agency id.
In the long term, I believe it will be highly beneficial for Hong Kong to maintain its own GTFS data format as a public data set. This will allow different applications like Google Map to have the best route information in order to advice the best travel route for customers. In addition, the experience from Google Map has established a great file format, which would include much more information that what the data.gov.HK has published at the moment.
Part 2 - Interesting Statistics
With the bus data in hand, I also plotted out some interesting statistics.
Box plot of number of bus stops per bus route
From the graph below, it shows that the median of each company is about 30 stations per bus route. Strangely, the largest number of bus stops per bus route for KMB has about 150 stations, which means around 75 stations per trip. By checking the data, the bus route is bus 53, which has 74 stations one way already. Here is a link to bus 53 route information on moovit and KMB website, which validates the results. [caption id=”attachment_662” align=”aligncenter” width=”800”] Box plot of number of bus stops per bus route
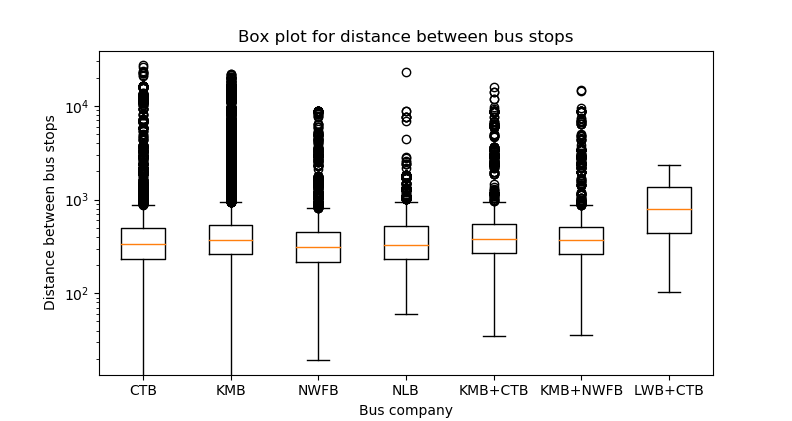
Box plot of distance between bus stops
The distance between bus stops is calculated using the inverse function in the pyproj library. This already includes the correction from longitude and latitude to distance on ground. Interestingly. The median distance between bus stop for each company is about 400m. Using 10 minute per km walking speed, this would take about 4-5 minutes for a normal person to walk from one bus stop to another.
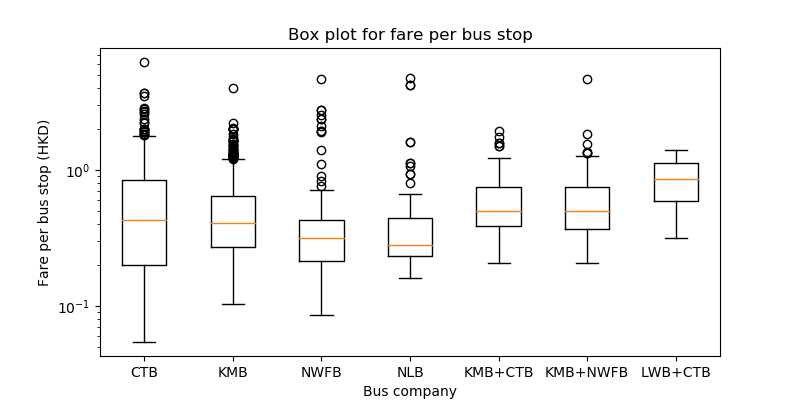
Box plot of price between bus stops
The fare per bus stop is calculated by the full fare divided by the number of bus stops in the trip. The discounted price is the middle is not included in the calculation. The median value is about $0.5 HKD per bus stop. This shows that each company has a very similar pricing strategy, when compared to their competitors. The most expensive fare per bus stop is NA21, which gives about $5.35 HKD per bus stop.
Conclusion
It is great that the HK government has taken the first step to open up the bus data with the data.gov.HK website and APIs. I believe the openness of data will help application developers to make better applications for building future “Smart Cities”. I believe that the following points still need to be tackled.
- How to guarantee the correctness and completeness of the public bus data?
- This can be done either by the public or by the government.
- When would Hong Kong government enforce bus companies to follow a global standard like GTFS?
- How to deliver real-time bus data into developers’ hands with sufficient security?
For your information, this article shows that one of our legislative council members, Charles Mok has already raised the issue of following GTFS format back in 2017 already. Hope that the Hong Kong government can open up more data with the best format possible. This will enable application developers to develop applications that make people’s life more convenient and more efficient.

Comments